Edit chart
Loading graph
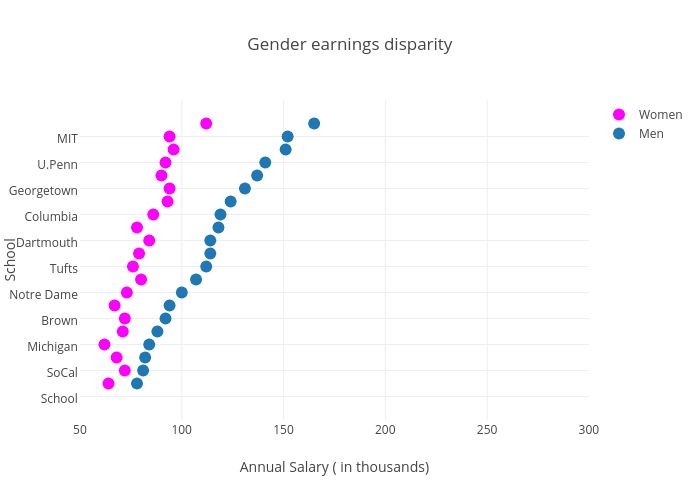
Tarzzz's interactive graph and data of "Gender earnings disparity" is a scatter chart, showing Women vs Men ; with Annual Salary ( in thousands) in the x-axis and School in the y-axis.. The x-axis shows values from 50 to 300. The y-axis shows values from -1.4615773508594538 to 22.461577350859454.