Edit chart
Loading graph
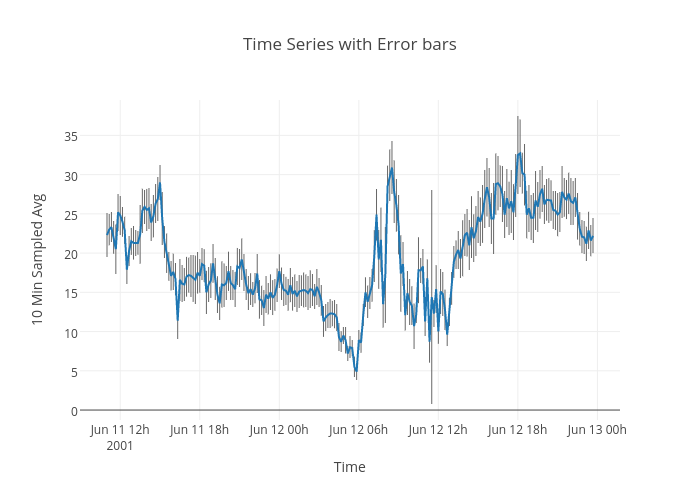
Tarzzz's interactive graph and data of "Time Series with Error bars" is a line chart, showing 10 Min Sampled Avg; with Time in the x-axis and 10 Min Sampled Avg in the y-axis.. The x-axis shows values from 992230066666.6666 to 992376733333.3334. The y-axis shows values from -1.2688888888888896 to 39.50888888888889.