Edit chart
Loading graph
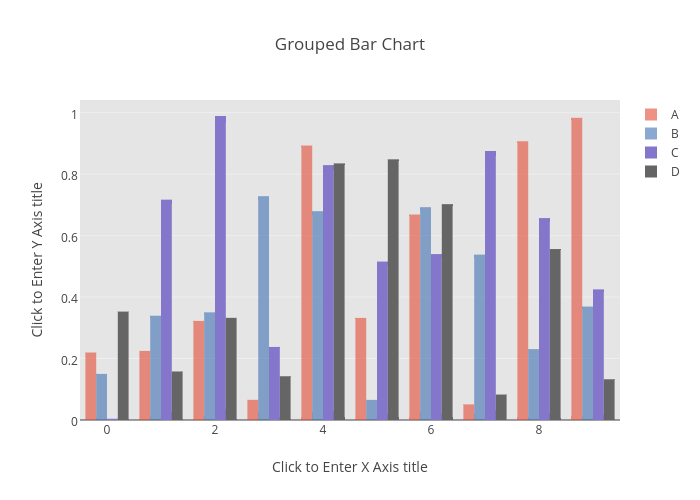
Tarzzz's interactive graph and data of "Grouped Bar Chart" is a bar chart, showing A, B, C, D; with Click to Enter X Axis title in the x-axis and Click to Enter Y Axis title in the y-axis.. The x-axis shows values from -0.5 to 9.5. The y-axis shows values from 0 to 1.0408971128231579.