Edit chart
Loading graph
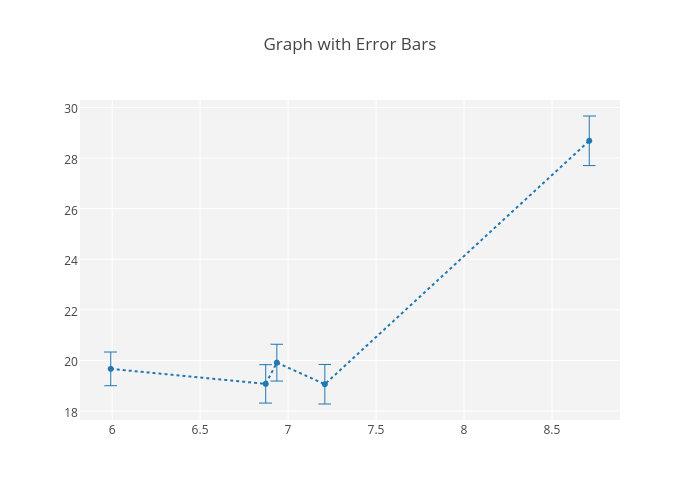
Tarzzz's interactive graph and data of "Graph with Error Bars" is a line chart, showing Col2. The x-axis shows values from 5.831332509784736 to 8.871567490215265. The y-axis shows values from 17.644367222222225 to 30.29622277777778.