Edit chart
Loading graph
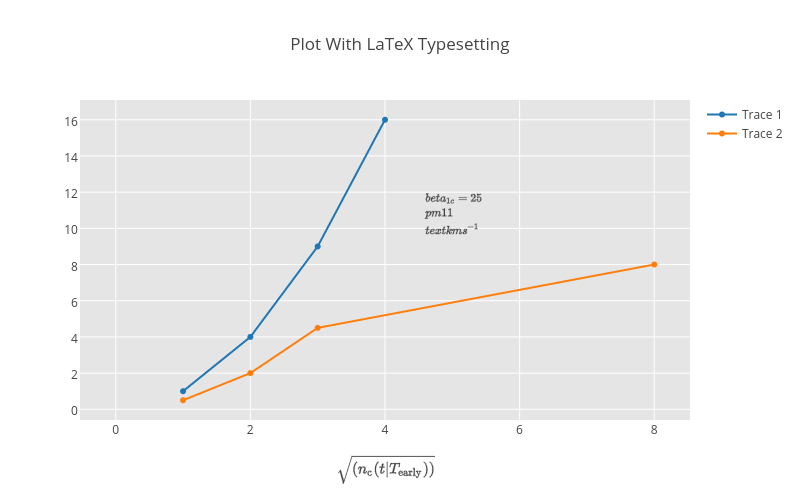
Tarzzz's interactive graph and data of "Plot With LaTeX Typesetting" is a scatter chart, showing Trace 1, Trace 2, y; with $\sqrt{(n_\text{c}(t|{T_\text{early}}))}$ in the x-axis. The x-axis shows values from -0.531104921077066 to 8.531104921077066. The y-axis shows values from -0.5913547237076648 to 17.091354723707664. This visualization has the following annotation: $\\beta_{1c} = 25 \\pm 11 \\text{ km s}^{-1}$