May 2014
Jul 2014
Sep 2014
Nov 2014
Jan 2015
Mar 2015
May 2015
Jul 2015
Sep 2015
Nov 2015
Jan 2016
Mar 2016
May 2016
Jul 2016
1100
1150
1200
1250
1300
1350
2 BedRoom
3 BedRoom
4 BedRoom
Average 3BR
5pts Moving Ave 3BR
Fit of 3 BedRoom
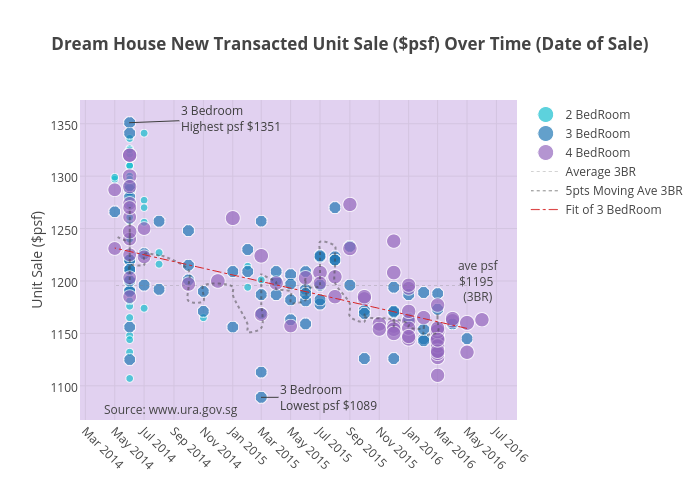
Dream House New Transacted Unit Sale ($psf) Over Time (Date of Sale)
Unit Sale ($psf)
Source:
www.ura.gov.sg
3 Bedroom
Highest psf $1351
3 Bedroom
Lowest psf $1089
ave psf
$1195
(3BR)
plotly-logomark
Edit chart
Tbeehoon's interactive graph and data of "Dream House New Transacted Unit Sale ($psf) Over Time (Date of Sale)" is a scatter chart, showing 2 BedRoom, 3 BedRoom, 4 BedRoom, Average 3BR, 5pts Moving Ave 3BR; with Unit Sale ($psf) in the y-axis. The x-axis shows values from 2014-03-12 05:03:55.609 to 2016-07-21 02:10:07.3526. The y-axis shows values from 1070.268371009708 to 1369.731628990292. This visualization has the following annotations: Source: www.ura.gov.sg; 3 BedroomHighest psf $1351; 3 Bedroom Lowest psf $1089; ave psf$1195 (3BR)