Apr-14
May-14
Jun-14
Jul-14
Aug-14
Sep-14
Oct-14
Nov-14
Dec-14
Jan-15
Feb-15
Mar-15
Apr-15
May-15
Jun-15
Jul-15
1200
1250
1300
1350
1400
1450
1500
Level 16-20 Units
Level 11-15 Units
Level 6-10 Units
Level 1-5 Units
Average of Lvl 1-5
Average of Lvl 6-10
Average of Lvl 11-15
Average of Lvl 16-20
5Pts Moving Ave Lvl 1-5
Fit of Level 1-5
Fit of Level 6-10
Fit of Level 11-15
Fit of Level 16-20
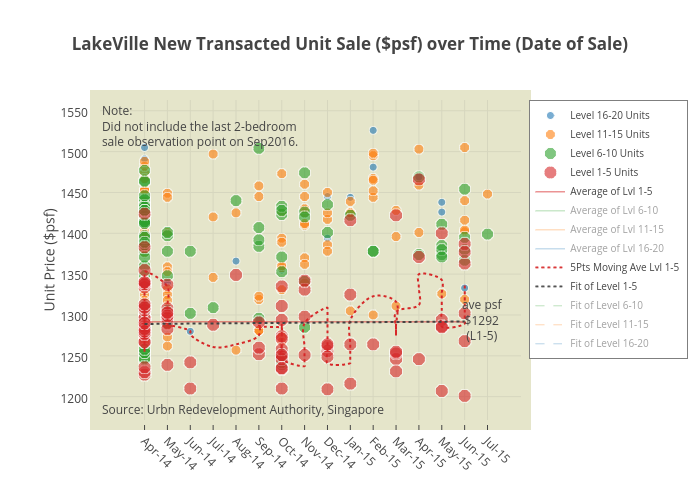
LakeVille New Transacted Unit Sale ($psf) over Time (Date of Sale)
Unit Price ($psf)
Note:
Did not include the last 2-bedroom
sale observation point on Sep2016.
Source:
Urbn Redevelopment Authority, Singapore
ave psf
$1292
(L1-5)
plotly-logomark
Edit chart
Tbeehoon's interactive graph and data of "LakeVille New Transacted Unit Sale ($psf) over Time (Date of Sale)" is a scatter chart, showing Level 16-20 Units, Level 11-15 Units, Level 6-10 Units, Level 1-5 Units, Average of Lvl 1-5, Average of Lvl 6-10 , Average of Lvl 11-15, Average of Lvl 16-20, 5Pts Moving Ave Lvl 1-5 , Fit of Level 1-5 , Fit of Level 6-10 , Fit of Level 11-15 , Fit of Level 16-20 ; with Unit Price ($psf) in the y-axis. The x-axis shows values from -1.1003316992984413 to 16.089323979217426. The y-axis shows values from 1176.6607252553058 to 1549.547526239533. This visualization has the following annotations: Note:Did not include the last 2-bedroomsale observation point on Sep2016.; Source: Urbn Redevelopment Authority, Singapore; ave psf$1292(L1-5)