Edit chart
Loading graph
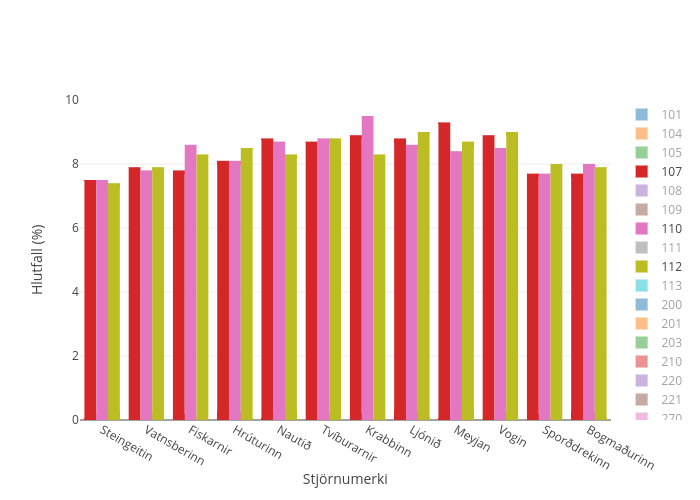
Tbs's interactive graph and data of "Hlutfall (%) vs Stjörnumerki" is a bar chart, showing 101, 104, 105, 107, 108, 109, 110, 111, 112, 113, 200, 201, 203, 210, 220, 221, 270; with Stjörnumerki in the x-axis and Hlutfall (%) in the y-axis.. The x-axis shows values from -0.5 to 11.5. The y-axis shows values from 0 to 10.