Edit chart
Loading graph
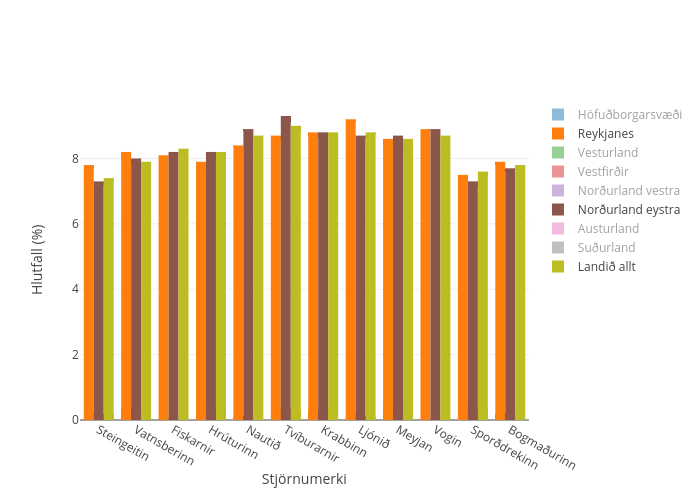
Tbs's interactive graph and data of "Hlutfall (%) vs Stjörnumerki" is a bar chart, showing Höfuðborgarsvæði, Reykjanes, Vesturland, Vestfirðir, Norðurland vestra, Norðurland eystra, Austurland, Suðurland, Landið allt; with Stjörnumerki in the x-axis and Hlutfall (%) in the y-axis.. The x-axis shows values from -0.5 to 11.5. The y-axis shows values from 0 to 9.789473684210527.