Edit chart
Loading graph
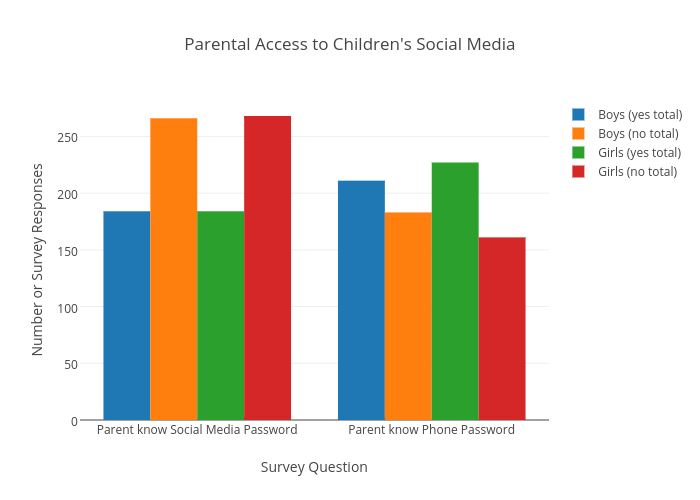
Tccook12's interactive graph and data of "Parental Access to Children's Social Media" is a bar chart, showing Boys (yes total), Boys (no total), Girls (yes total), Girls (no total); with Survey Question in the x-axis and Number or Survey Responses in the y-axis.. The x-axis shows values from -0.5 to 1.5. The y-axis shows values from 0 to 282.10526315789474.