Edit chart
Loading graph
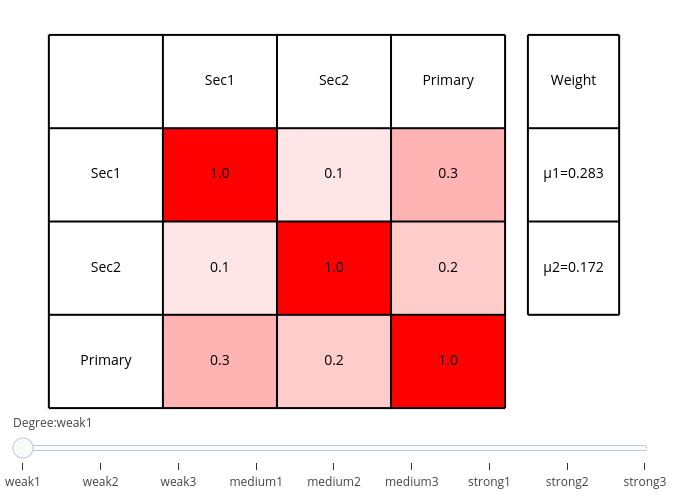
Terrorprince's interactive graph and data of "{'font': {'size': 20}}" is a heatmap. The x-axis shows values from -1.7973340842955037 to 3.7973340842955037. The y-axis shows values from -0.7780569514237856 to 3.7780569514237854.