Edit chart
Loading graph
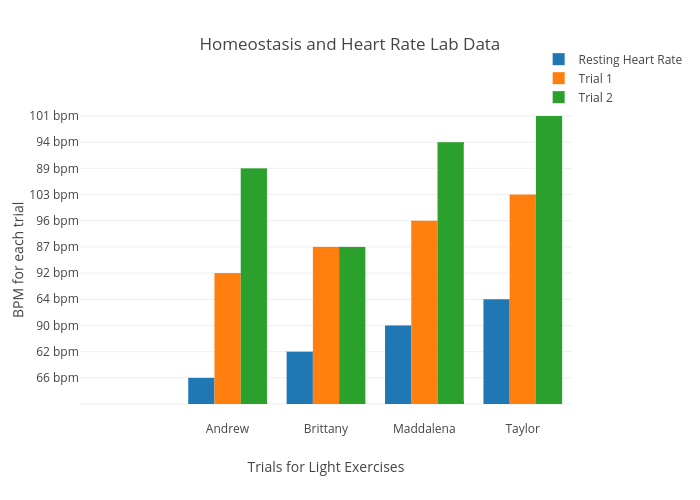
Thaught13's interactive graph and data of "Homeostasis and Heart Rate Lab Data" is a bar chart, showing Resting Heart Rate, Trial 1, Trial 2; with Trials for Light Exercises in the x-axis and BPM for each trial in the y-axis.. The x-axis shows values from -0.5 to 4.5. The y-axis shows values from -0.6111111111111113 to 11.61111111111111.