Edit chart
Loading graph
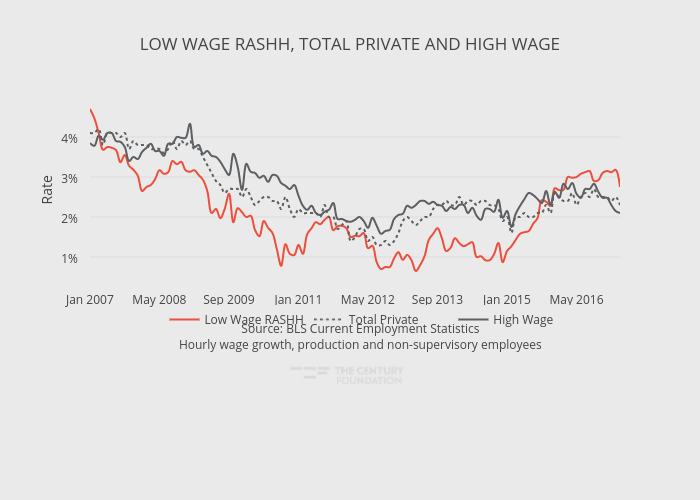
Thecenturyfoundation's interactive graph and data of "LOW WAGE RASHH, TOTAL PRIVATE AND HIGH WAGE" is a line chart, showing Low Wage RASHH, Total Private, High Wage; with in the x-axis and Rate in the y-axis.. The x-axis shows values from 0 to 122. The y-axis shows values from 0.42500000000000004 to 4.925. This visualization has the following annotation: Source: BLS Current Employment StatisticsHourly wage growth, production and non-supervisory employees