Edit chart
Loading graph
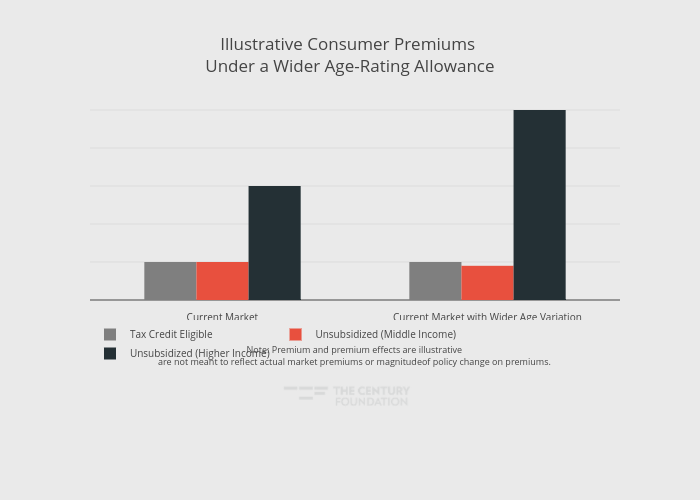
Thecenturyfoundation's interactive graph and data of "Illustrative Consumer Premiums Under a Wider Age-Rating Allowance" is a bar chart, showing Tax Credit Eligible, Unsubsidized (Middle Income), Unsubsidized (Higher Income); with in the x-axis. The x-axis shows values from -0.5 to 1.5. The y-axis shows values from 0 to 526.3157894736842. This visualization has the following annotation: Note: Premium and premium effects are illustrativeare not meant to reflect actual market premiums or magnitudeof policy change on premiums.