Edit chart
Loading graph
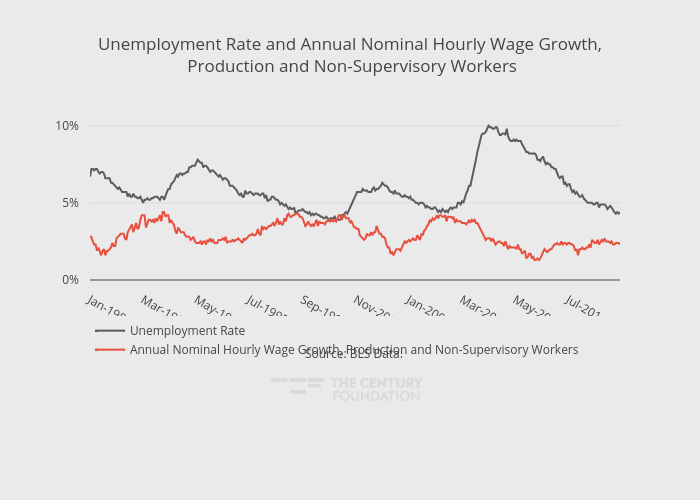
Thecenturyfoundation's interactive graph and data of "Unemployment Rate and Annual Nominal Hourly Wage Growth, Production and Non-Supervisory Workers" is a line chart, showing Unemployment Rate vs Annual Nominal Hourly Wage Growth, Production and Non-Supervisory Workers; with in the x-axis. The x-axis shows values from 0 to 379. The y-axis shows values from 0 to 11.664776307498427. This visualization has the following annotation: Source: BLS Data.