Edit chart
Loading graph
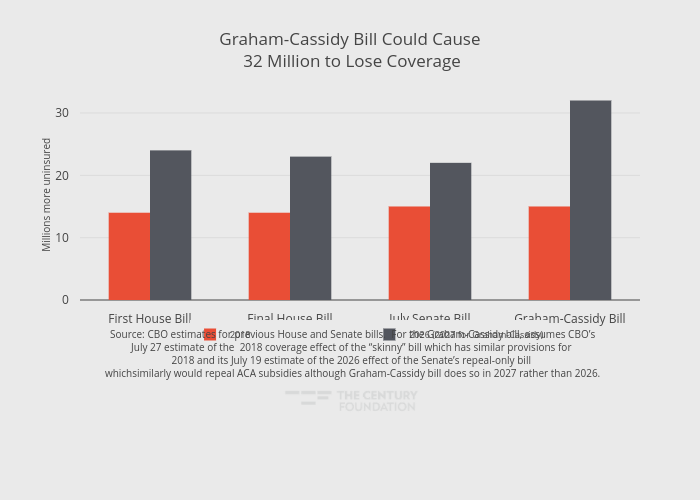
Thecenturyfoundation's interactive graph and data of "Graham-Cassidy Bill Could Cause 32 Million to Lose Coverage" is a grouped bar chart, showing 2018 vs 2026 (2027 for Graham-Cassidy); with in the x-axis and Millions more uninsured in the y-axis.. The x-axis shows values from -0.5 to 3.5. The y-axis shows values from 0 to 33.68421052631579. This visualization has the following annotation: Source: CBO estimates for previous House and Senate bills. For the Graham-Cassidy bill, assumes CBO’s<br>July 27 estimate of the 2018 coverage effect of the “skinny” bill which has similar provisions for <br>2018 and its July 19 estimate of the 2026 effect of the Senate’s repeal-only bill <br>whichsimilarly would repeal ACA subsidies although Graham-Cassidy bill does so in 2027 rather than 2026.