Edit chart
Loading graph
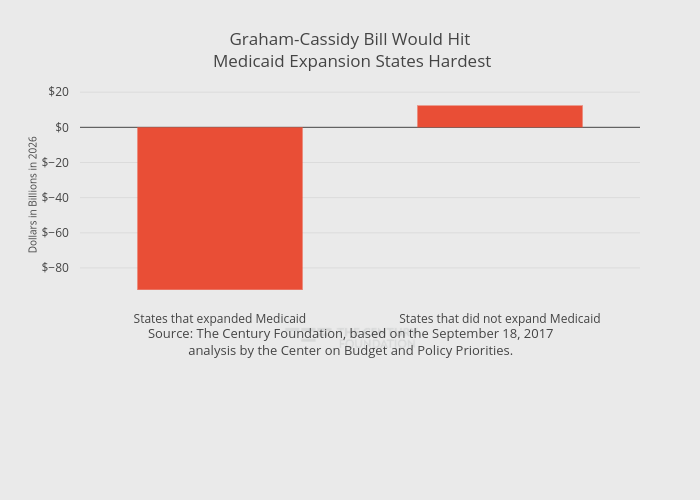
Thecenturyfoundation's interactive graph and data of "Graham-Cassidy Bill Would Hit Medicaid Expansion States Hardest" is a bar chart, showing Jobs; with in the x-axis and Dollars in Billions in 2026 in the y-axis.. The x-axis shows values from -0.5 to 1.5. The y-axis shows values from -98.22222222222223 to 21.222222222222225. This visualization has the following annotation: Source: The Century Foundation, based on the September 18, 2017 analysis by the Center on Budget and Policy Priorities.