Edit chart
Loading graph
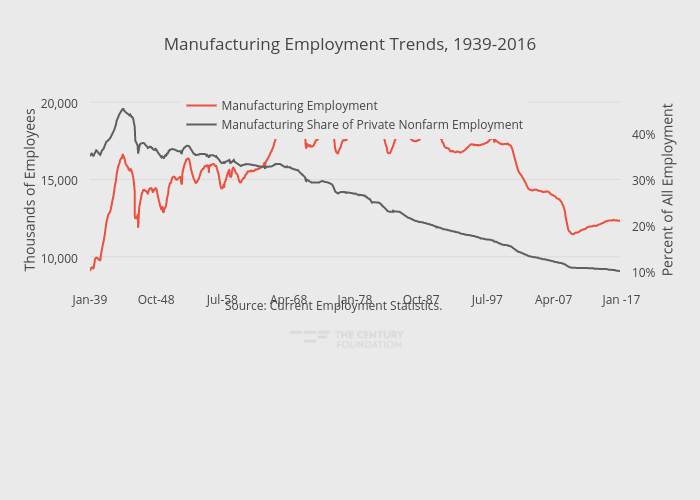
Thecenturyfoundation's interactive graph and data of "Manufacturing Employment Trends, 1939-2016" is a line chart, showing Manufacturing Employment vs Manufacturing Share of Private Nonfarm Employment; with in the x-axis and Thousands of Employees in the y-axis.. The x-axis shows values from 0 to 936. The y-axis shows values from 8495 to 20135. This visualization has the following annotation: Source: Current Employment Statistics.