Edit chart
Loading graph
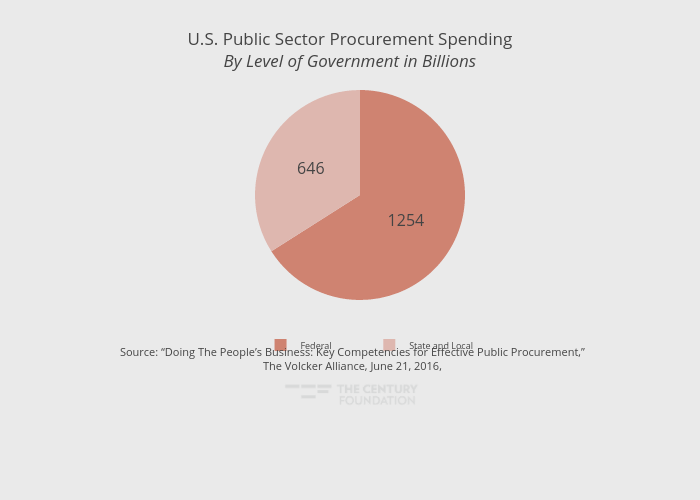
Thecenturyfoundation's interactive graph and data of "U.S. Public Sector Procurement SpendingBy Level of Government in Billions" is a pie, showing Level of Government in Billions. The x-axis shows values from 0 to 0. The y-axis shows values from 0 to 0. This visualization has the following annotation: Source: “Doing The People’s Business: Key Competencies for Effective Public Procurement,” The Volcker Alliance, June 21, 2016,