Edit chart
Loading graph
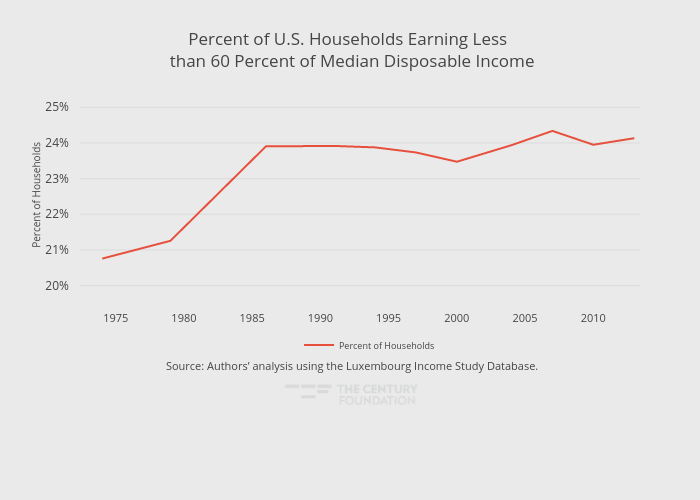
Thecenturyfoundation's interactive graph and data of "Percent of U.S. Households Earning Less than 60 Percent of Median Disposable Income" is a line chart, showing Percent of Households; with in the x-axis and Percent of Households in the y-axis.. The x-axis shows values from 1972.3720090178688 to 2013.4193147092972. The y-axis shows values from 19.596341686664406 to 25.484032045617603. This visualization has the following annotation: Source: Authors’ analysis using the Luxembourg Income Study Database.