Edit chart
Loading graph
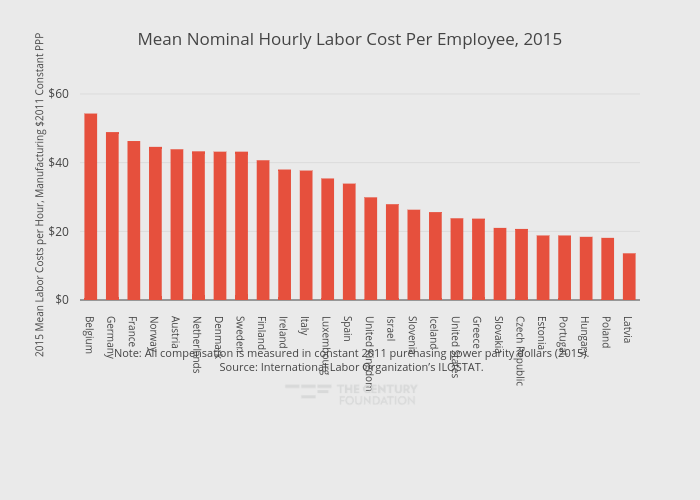
Thecenturyfoundation's interactive graph and data of "Mean Nominal Hourly Labor Cost Per Employee, 2015" is a bar chart, showing 2015 Mean Labor Costs per Hour, Manufacturing $2011 Constant PPP; with in the x-axis and 2015 Mean Labor Costs per Hour, Manufacturing $2011 Constant PPP in the y-axis.. The x-axis shows values from -0.5 to 25.5. The y-axis shows values from 0 to 61.1578947368421. This visualization has the following annotation: Note: All compensation is measured in constant 2011 purchasing power parity dollars (2015).<br>Source: International Labor Organization’s ILOSTAT.