Edit chart
Loading graph
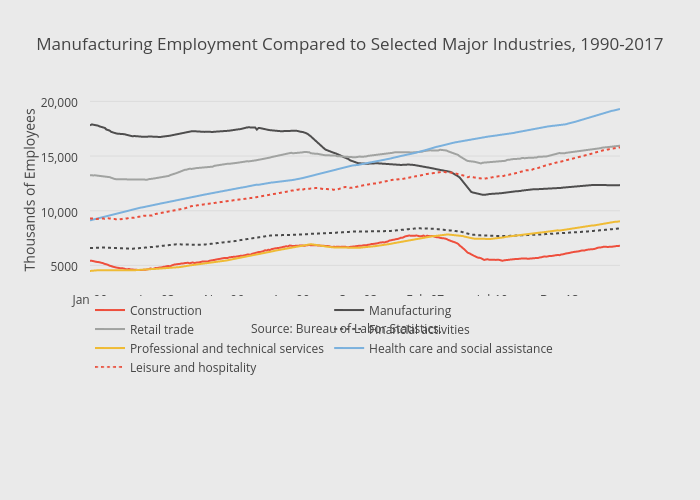
Thecenturyfoundation's interactive graph and data of "Manufacturing Employment Compared to Selected Major Industries, 1990-2017" is a line chart, showing Construction, Manufacturing, Retail trade, Financial activities, Professional and technical services, Health care and social assistance, Leisure and hospitality; with in the x-axis and Thousands of Employees in the y-axis.. The x-axis shows values from 0 to 324. The y-axis shows values from 3661.411111111111 to 20127.18888888889. This visualization has the following annotation: Source: Bureau of Labor Statistics.