Edit chart
Loading graph
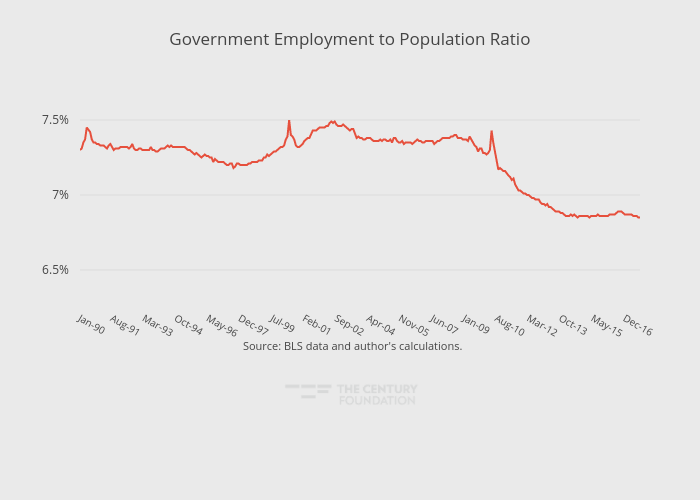
Thecenturyfoundation's interactive graph and data of "Government Employment to Population Ratio" is a line chart, showing Government Employment to Population Ratio; with in the x-axis. The x-axis shows values from 0 to 332. The y-axis shows values from 6.3 to 7.7. This visualization has the following annotation: Source: BLS data and author's calculations.