Edit chart
Loading graph
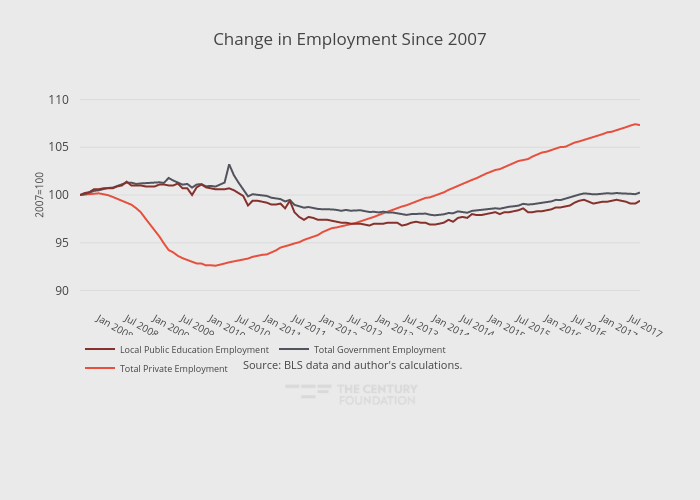
Thecenturyfoundation's interactive graph and data of "Change in Employment Since 2007" is a line chart, showing Total Private Employment, Total Government Employment, Local Public Education Employment; with in the x-axis and 2007=100 in the y-axis.. The x-axis shows values from 2007-09-01 to 2017-09-01. The y-axis shows values from 89 to 111. This visualization has the following annotation: Source: BLS data and author's calculations.