Edit chart
Loading graph
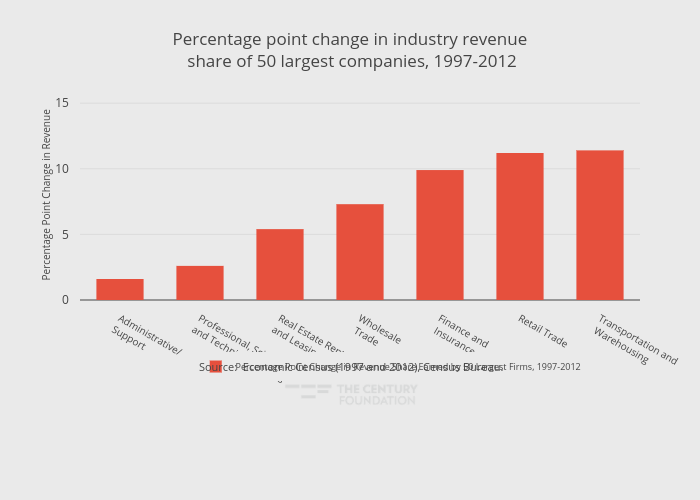
Thecenturyfoundation's interactive graph and data of "Percentage point change in industry revenue share of 50 largest companies, 1997-2012" is a bar chart, showing Percentage Point Change in Revenue Share Earned by 50 Largest Firms, 1997-2012; with in the x-axis and Percentage Point Change in Revenue in the y-axis.. The x-axis shows values from -0.5 to 6.5. The y-axis shows values from 0 to 16. This visualization has the following annotation: Source: Economic Census (1997 and 2012), Census Bureau.