Edit chart
Loading graph
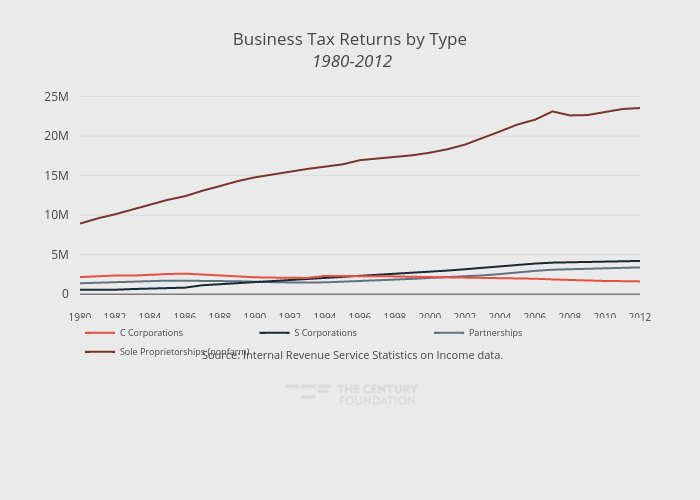
Thecenturyfoundation's interactive graph and data of "Business Tax Returns by Type 1980-2012" is a line chart, showing Sole Proprietorships (nonfarm), Partnerships, S Corporations, C Corporations; with in the x-axis. The x-axis shows values from 1980 to 2012. The y-axis shows values from -736975.5000000002 to 25832314.5. This visualization has the following annotation: Source: Internal Revenue Service Statistics on Income data.