Edit chart
Loading graph
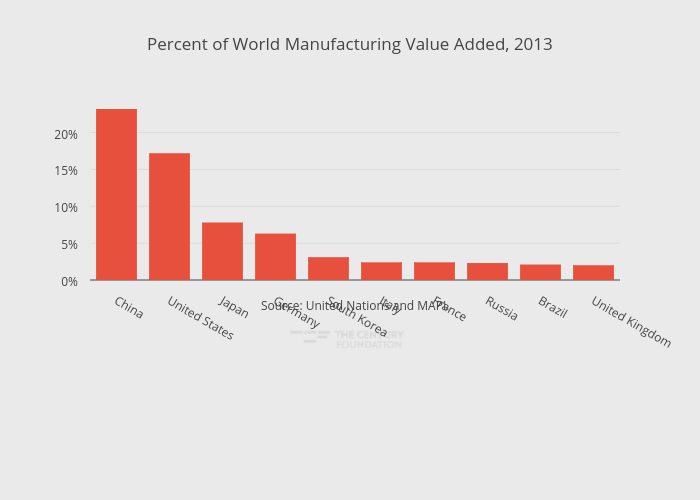
Thecenturyfoundation's interactive graph and data of "Percent of World Manufacturing Value Added, 2013" is a bar chart, showing Percent of World Manufacturing Value Added; with in the x-axis. The x-axis shows values from -0.5 to 9.5. The y-axis shows values from 0 to 24.421052631578945. This visualization has the following annotation: Source: United Nations and MAPI.