Edit chart
Loading graph
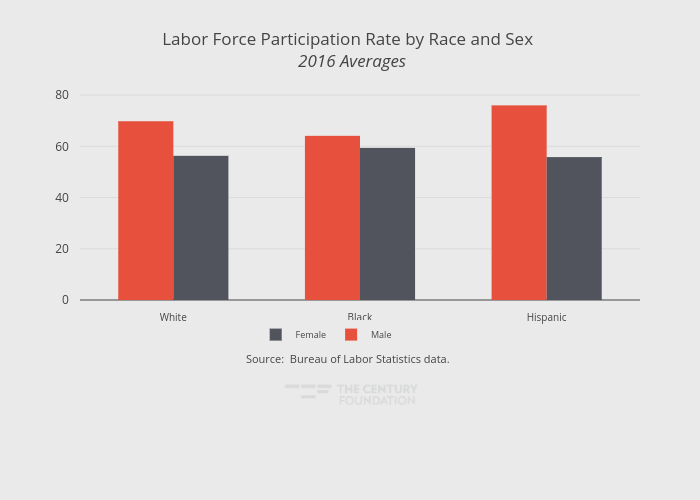
Thecenturyfoundation's interactive graph and data of "Labor Force Participation Rate by Race and Sex 2016 Averages" is a grouped bar chart, showing Male vs Female; with in the x-axis. The x-axis shows values from -0.5 to 2.5. The y-axis shows values from 0 to 82. This visualization has the following annotation: Source: Bureau of Labor Statistics data.