Edit chart
Loading graph
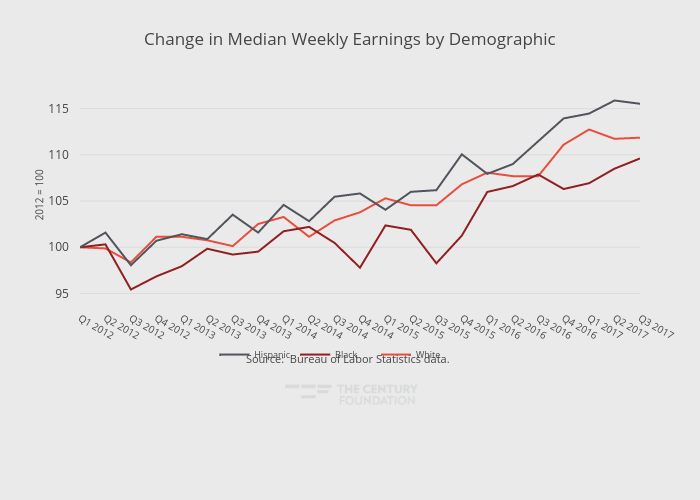
Thecenturyfoundation's interactive graph and data of "Change in Median Weekly Earnings by Demographic" is a line chart, showing White, Black, Hispanic; with in the x-axis and 2012 = 100 in the y-axis.. The x-axis shows values from 0 to 22. The y-axis shows values from 94.29751836833333 to 117.00856840166666. This visualization has the following annotation: Source: Bureau of Labor Statistics data.