Edit chart
Loading graph
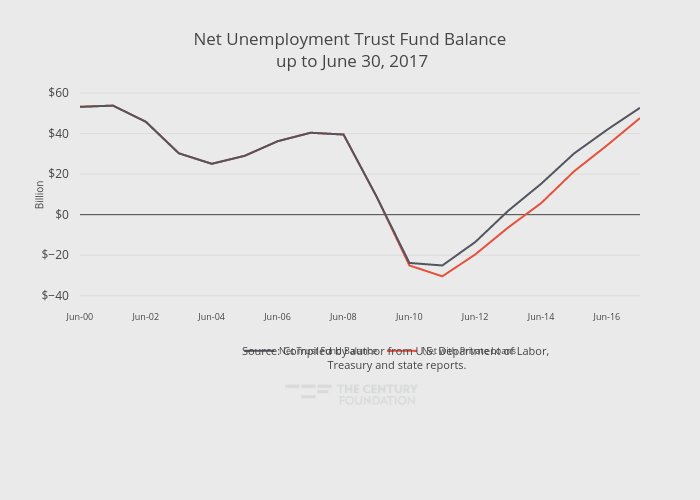
Thecenturyfoundation's interactive graph and data of "Net Unemployment Trust Fund Balance up to June 30, 2017" is a line chart, showing Net with Private Loans vs Net Trust Fund Balance; with in the x-axis and Billion in the y-axis.. The x-axis shows values from 0 to 17. The y-axis shows values from -42.077777777777776 to 61.477777777777774. This visualization has the following annotation: Source: Compiled by author from U.S. Department of Labor, Treasury and state reports.