Edit chart
Loading graph
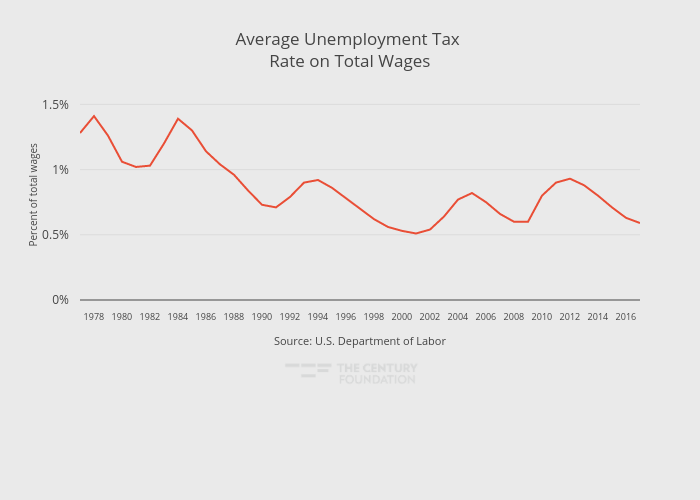
Thecenturyfoundation's interactive graph and data of "Average Unemployment Tax Rate on Total Wages" is a line chart, showing Net with Private Loans; with in the x-axis and Percent of total wages in the y-axis.. The x-axis shows values from 1977 to 2017. The y-axis shows values from 0 to 1.61. This visualization has the following annotation: Source: U.S. Department of Labor