Edit chart
Loading graph
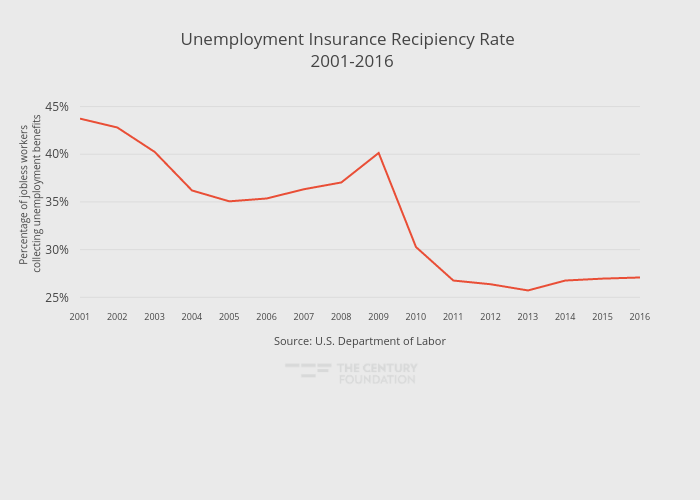
Thecenturyfoundation's interactive graph and data of "Unemployment Insurance Recipiency Rate 2001-2016" is a line chart, showing Net with Private Loans; with in the x-axis and Percentage of jobless workers collecting unemployment benefits in the y-axis.. The x-axis shows values from 2001 to 2016. The y-axis shows values from 24.719444444444445 to 46.730555555555554. This visualization has the following annotation: Source: U.S. Department of Labor