Edit chart
Loading graph
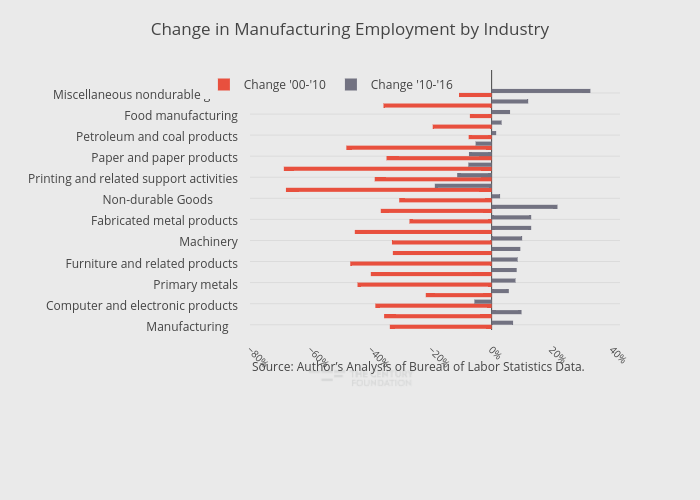
Thecenturyfoundation's interactive graph and data of "Change in Manufacturing Employment by Industry" is a bar chart, showing Change '00-'10 vs Change '10-'16; with in the x-axis. The x-axis shows values from -80 to 42.50324656512132. The y-axis shows values from -0.5 to 24.180634554436352. This visualization has the following annotation: Source: Author’s Analysis of Bureau of Labor Statistics Data.