Edit chart
Loading graph
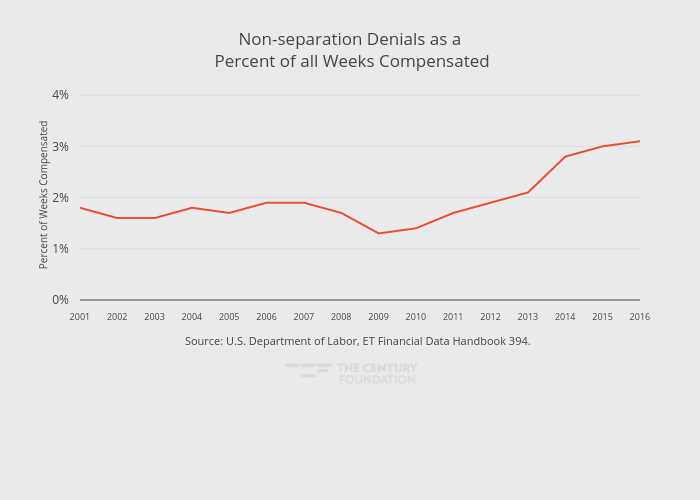
Thecenturyfoundation's interactive graph and data of "Non-separation Denials as a Percent of all Weeks Compensated" is a line chart, showing Net with Private Loans; with in the x-axis and Percent of Weeks Compensated in the y-axis.. The x-axis shows values from 2001 to 2016. The y-axis shows values from 0 to 4.1. This visualization has the following annotation: Source: U.S. Department of Labor, ET Financial Data Handbook 394.