Edit chart
Loading graph
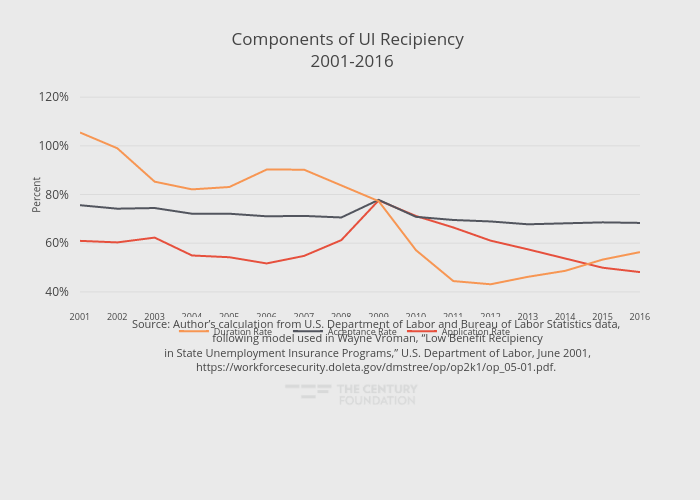
Thecenturyfoundation's interactive graph and data of "Components of UI Recipiency 2001-2016" is a line chart, showing Application Rate, Acceptance Rate, Duration Rate; with in the x-axis and Percent in the y-axis.. The x-axis shows values from 2001 to 2016. The y-axis shows values from 36.644999999999996 to 122.94500000000001. This visualization has the following annotation: Source: Author’s calculation from U.S. Department of Labor and Bureau of Labor Statistics data, following model used in Wayne Vroman, “Low Benefit Recipiency in State Unemployment Insurance Programs,” U.S. Department of Labor, June 2001, https://workforcesecurity.doleta.gov/dmstree/op/op2k1/op_05-01.pdf.