Edit chart
Loading graph
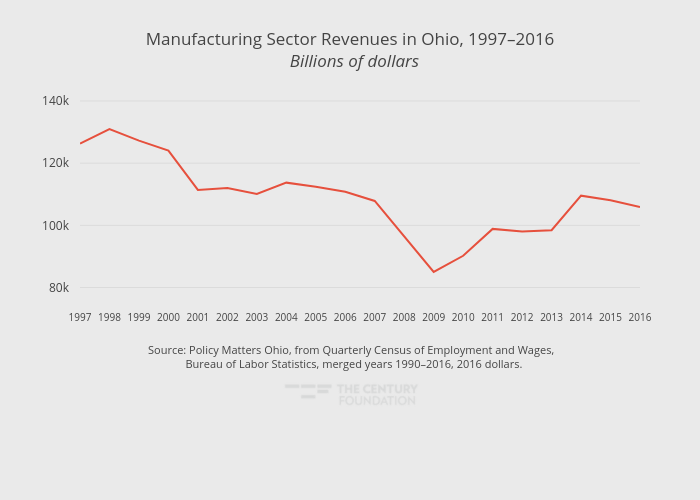
Thecenturyfoundation's interactive graph and data of "Manufacturing Sector Revenues in Ohio, 1997–2016 Billions of dollars" is a line chart, showing Manufacturing GDP; with in the x-axis. The x-axis shows values from 1997 to 2016. The y-axis shows values from 75989 to 143532.78161777777. This visualization has the following annotation: Source: Policy Matters Ohio, from Quarterly Census of Employment and Wages, Bureau of Labor Statistics, merged years 1990–2016, 2016 dollars.