Edit chart
Loading graph
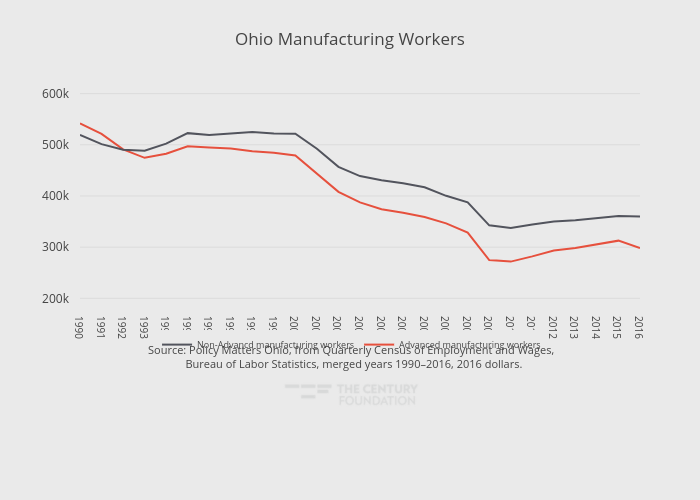
Thecenturyfoundation's interactive graph and data of "Ohio Manufacturing Workers" is a line chart, showing Advanced manufacturing workers vs Non-Advancd manufacturing workers; with in the x-axis. The x-axis shows values from 1990 to 2016. The y-axis shows values from 196714.61111111112 to 606982.3888888889. This visualization has the following annotation: Source: Policy Matters Ohio, from Quarterly Census of Employment and Wages, Bureau of Labor Statistics, merged years 1990–2016, 2016 dollars.