Edit chart
Loading graph
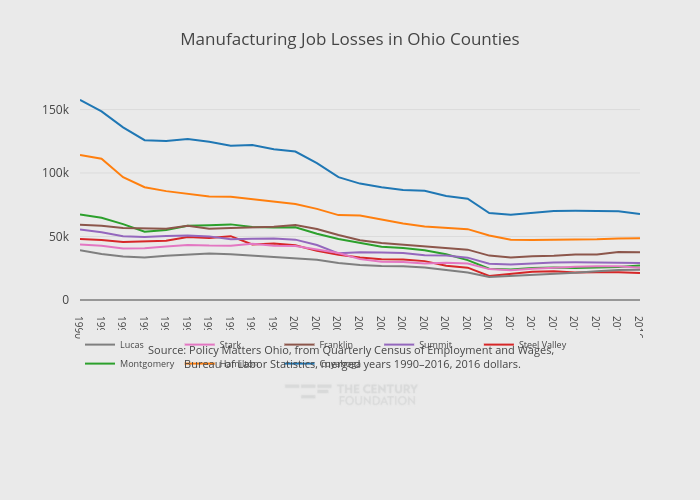
Thecenturyfoundation's interactive graph and data of "Manufacturing Job Losses in Ohio Counties" is a line chart, showing Cuyahoga , Hamilton, Montgomery, Steel Valley, Summit, Franklin, Stark, Lucas; with in the x-axis. The x-axis shows values from 1990 to 2016. The y-axis shows values from 0 to 165365.27777777778. This visualization has the following annotation: Source: Policy Matters Ohio, from Quarterly Census of Employment and Wages, Bureau of Labor Statistics, merged years 1990–2016, 2016 dollars.