Edit chart
Loading graph
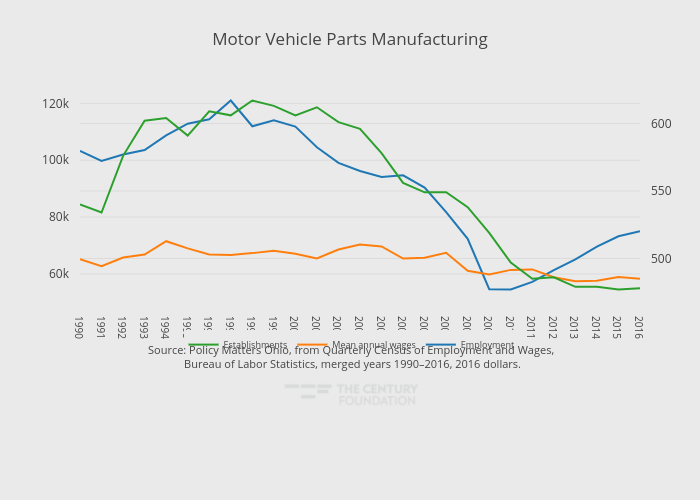
Thecenturyfoundation's interactive graph and data of "Motor Vehicle Parts Manufacturing" is a line chart, showing Employment, Mean annual wages, Establishments; with in the x-axis. The x-axis shows values from 1990 to 2016. The y-axis shows values from 50833.444444444445 to 124684.55555555556. This visualization has the following annotation: Source: Policy Matters Ohio, from Quarterly Census of Employment and Wages, Bureau of Labor Statistics, merged years 1990–2016, 2016 dollars.