Edit chart
Loading graph
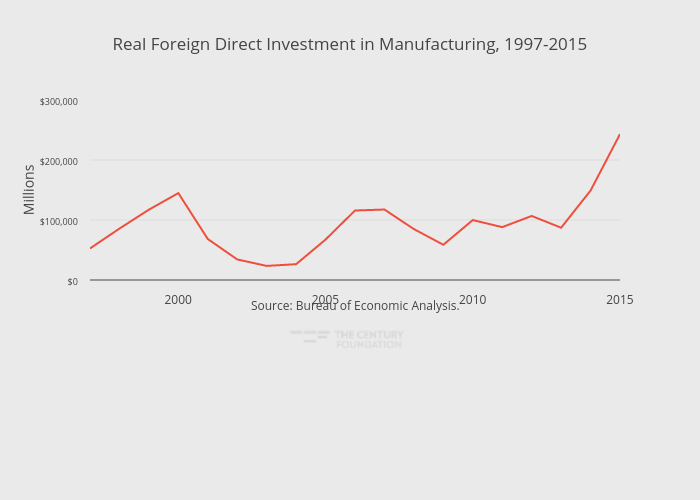
Thecenturyfoundation's interactive graph and data of "Real Foreign Direct Investment in Manufacturing, 1997-2015" is a line chart, showing Real Foreign Direct Investment in Manufacturing; with in the x-axis and Millions in the y-axis.. The x-axis shows values from 1997 to 2015. The y-axis shows values from 0 to 300000. This visualization has the following annotation: Source: Bureau of Economic Analysis.