Edit chart
Loading graph
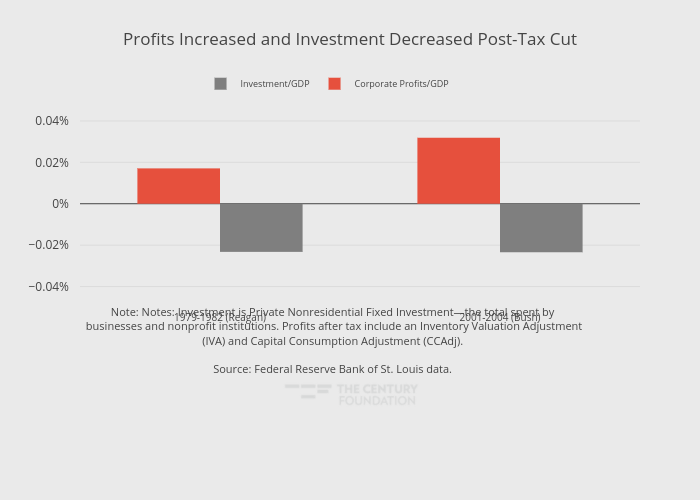
Thecenturyfoundation's interactive graph and data of "Profits Increased and Investment Decreased Post-Tax Cut" is a grouped bar chart, showing Corporate Profits/GDP vs Investment/GDP; with in the x-axis. The x-axis shows values from -0.5 to 1.5. The y-axis shows values from -0.04651296055555555 to 0.05494999055555556. This visualization has the following annotation: Note: Notes: Investment is Private Nonresidential Fixed Investment—the total spent by<br> businesses and nonprofit institutions. Profits after tax include an Inventory Valuation Adjustment<br> (IVA) and Capital Consumption Adjustment (CCAdj). Source: Federal Reserve Bank of St. Louis data.