Edit chart
Loading graph
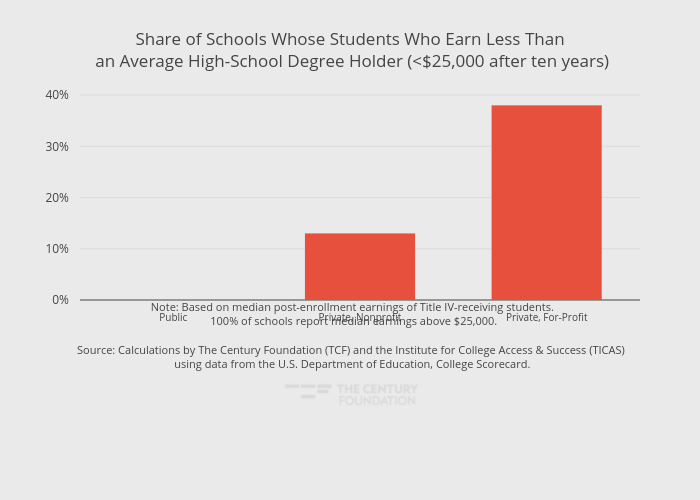
Thecenturyfoundation's interactive graph and data of "Share of Schools Whose Students Who Earn Less Than an Average High-School Degree Holder ( in the x-axis. The x-axis shows values from -0.5 to 2.5. The y-axis shows values from 0 to 41. This visualization has the following annotation: Note: Based on median post-enrollment earnings of Title IV-receiving students.<br> 100% of schools report median earnings above $25,000.Source: Calculations by The Century Foundation (TCF) and the Institute for College Access & Success (TICAS) <br>using data from the U.S. Department of Education, College Scorecard.