Edit chart
Loading graph
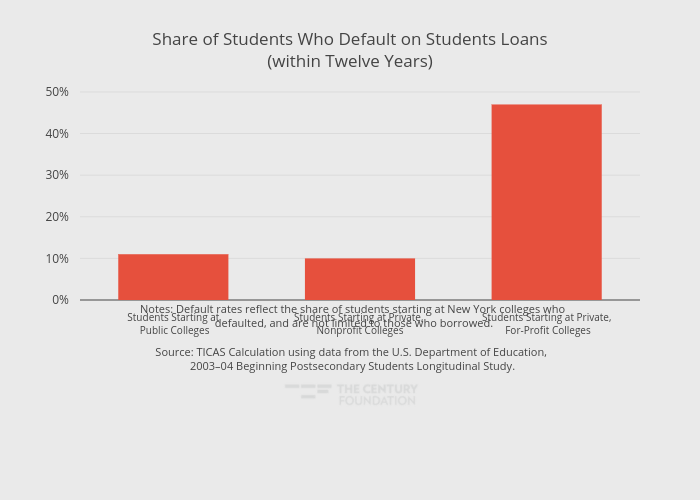
Thecenturyfoundation's interactive graph and data of "Share of Students Who Default on Students Loans(within Twelve Years)" is a bar chart, showing Share of Students; with in the x-axis. The x-axis shows values from -0.5 to 2.5. The y-axis shows values from 0 to 50.473684210526315. This visualization has the following annotation: Notes: Default rates reflect the share of students starting at New York colleges who<br> defaulted, and are not limited to those who borrowed.Source: TICAS Calculation using data from the U.S. Department of Education, <br>2003–04 Beginning Postsecondary Students Longitudinal Study.