Edit chart
Loading graph
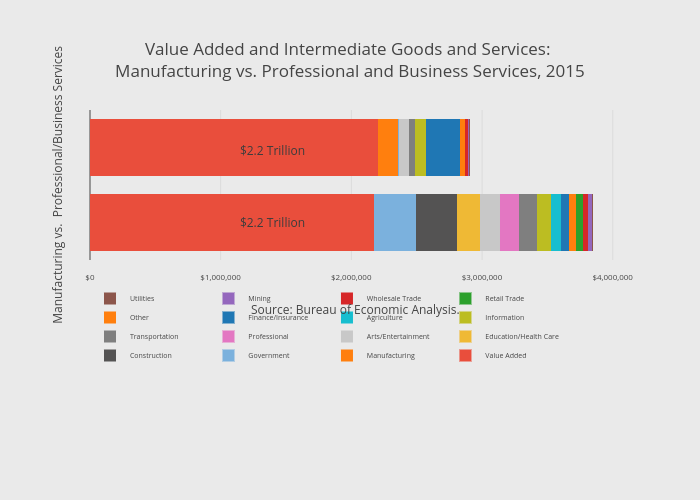
Thecenturyfoundation's interactive graph and data of "Value Added and Intermediate Goods and Services: <br />Manufacturing vs. Professional and Business Services, 2015" is a stacked bar chart, showing Value Added, Manufacturing, Government, Construction, Education/Health Care, Arts/Entertainment, Professional, Transportation, Information, Agriculture, Finance/Insurance, Other, Retail Trade, Wholesale Trade, Mining, Utilities; with Millions in the x-axis and Manufacturing vs. Professional/Business Services in the y-axis.. The x-axis shows values from 0 to 4055281.052631579. The y-axis shows values from -0.5 to 1.5. This visualization has the following annotations: Source: Bureau of Economic Analysis.; $2.2 Trillion; $2.2 Trillion