Edit chart
Loading graph
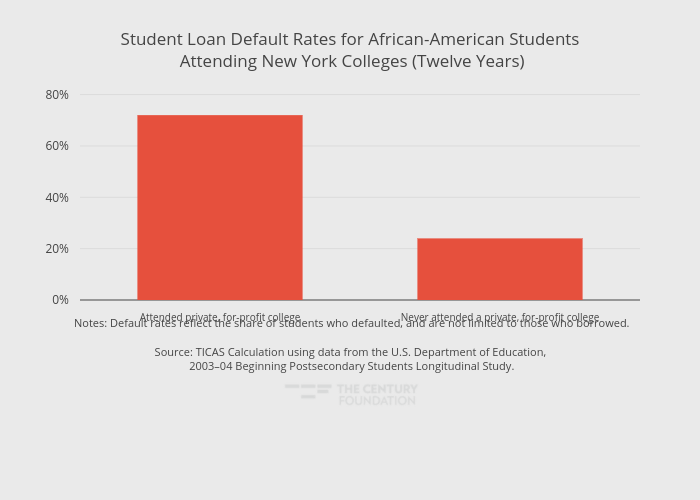
Thecenturyfoundation's interactive graph and data of "Student Loan Default Rates for African-American Students Attending New York Colleges (Twelve Years)" is a bar chart, showing Share of New York Student Enrollments; with in the x-axis. The x-axis shows values from -0.5 to 1.5. The y-axis shows values from 0 to 81.78947368421052. This visualization has the following annotation: Notes: Default rates reflect the share of students who defaulted, and are not limited to those who borrowed.Source: TICAS Calculation using data from the U.S. Department of Education, <br>2003–04 Beginning Postsecondary Students Longitudinal Study.