Edit chart
Loading graph
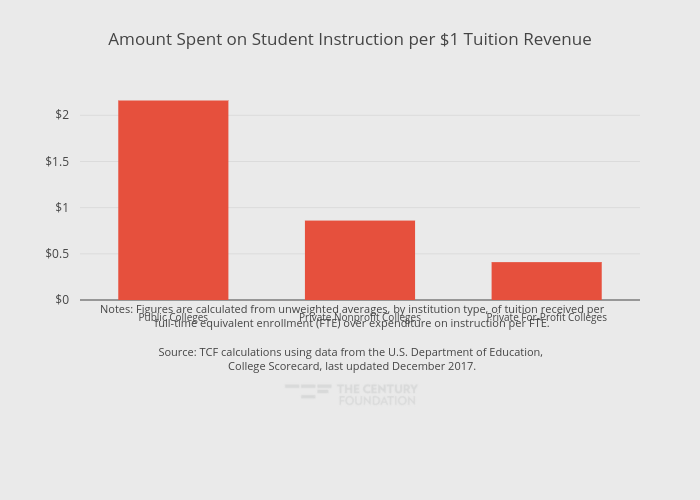
Thecenturyfoundation's interactive graph and data of "Amount Spent on Student Instruction per $1 Tuition Revenue" is a bar chart, showing Student Instruction per $1 Tuitition; with in the x-axis. The x-axis shows values from -0.5 to 2.5. The y-axis shows values from 0 to 2.2736842105263158. This visualization has the following annotation: Notes: Figures are calculated from unweighted averages, by institution type, of tuition received per<br> full-time equivalent enrollment (FTE) over expenditure on instruction per FTE. Source: TCF calculations using data from the U.S. Department of Education, <br>College Scorecard, last updated December 2017.