Edit chart
Loading graph
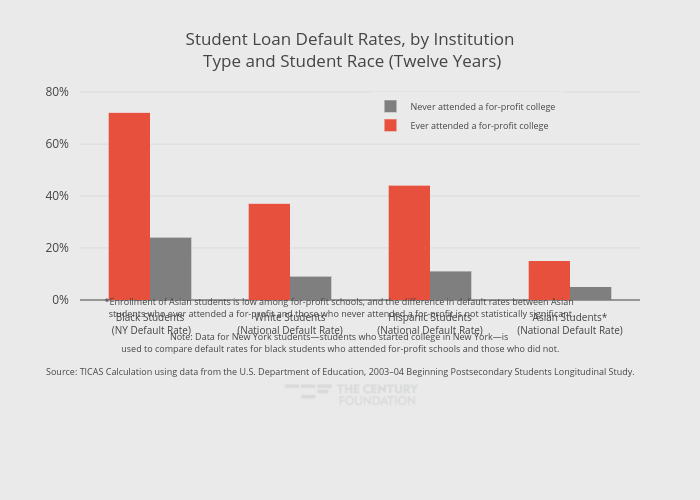
Thecenturyfoundation's interactive graph and data of "Student Loan Default Rates, by Institution Type and Student Race (Twelve Years)" is a grouped bar chart, showing Ever attended a for-profit college vs Never attended a for-profit college ; with in the x-axis. The x-axis shows values from -0.5 to 3.5. The y-axis shows values from 0 to 80.78947368421052. This visualization has the following annotation: *Enrollment of Asian students is low among for-profit schools, and the difference in default rates between Asian <br> students who ever attended a for-profit and those who never attended a for-profit is not statistically significant.Note: Data for New York students—students who started college in New York—is <br>used to compare default rates for black students who attended for-profit schools and those who did not.Source: TICAS Calculation using data from the U.S. Department of Education, 2003–04 Beginning Postsecondary Students Longitudinal Study.