Edit chart
Loading graph
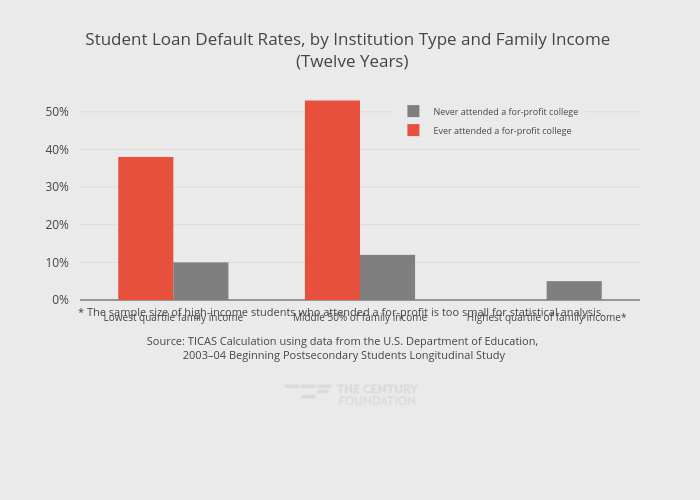
Thecenturyfoundation's interactive graph and data of "Student Loan Default Rates, by Institution Type and Family Income (Twelve Years)" is a grouped bar chart, showing Ever attended a for-profit college vs Never attended a for-profit college ; with in the x-axis. The x-axis shows values from -0.5 to 2.5. The y-axis shows values from 0 to 55.78947368421053. This visualization has the following annotation: * The sample size of high-income students who attended a for-profit is too small for statistical analysis. <br>Source: TICAS Calculation using data from the U.S. Department of Education,<br> 2003–04 Beginning Postsecondary Students Longitudinal Study