Edit chart
Loading graph
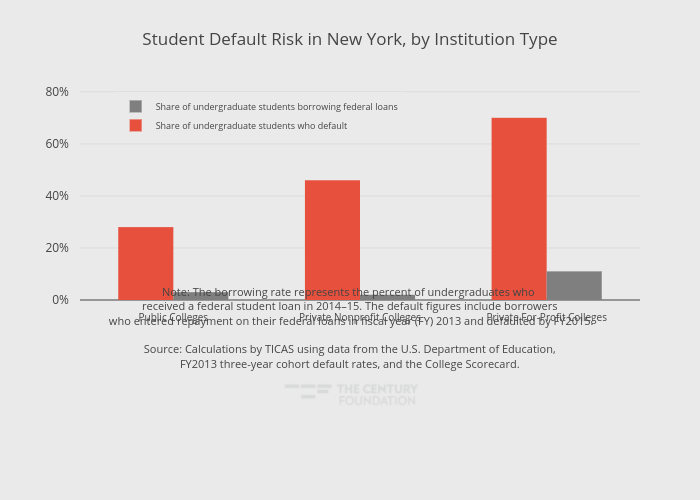
Thecenturyfoundation's interactive graph and data of "Student Default Risk in New York, by Institution Type" is a grouped bar chart, showing Share of undergraduate students who default vs Share of undergraduate students borrowing federal loans; with in the x-axis. The x-axis shows values from -0.5 to 2.5. The y-axis shows values from 0 to 80.6842105263158. This visualization has the following annotation: Note: The borrowing rate represents the percent of undergraduates who <br>received a federal student loan in 2014–15. The default figures include borrowers<br> who entered repayment on their federal loans in fiscal year (FY) 2013 and defaulted by FY2015.Source: Calculations by TICAS using data from the U.S. Department of Education,<br> FY2013 three-year cohort default rates, and the College Scorecard.