Edit chart
Loading graph
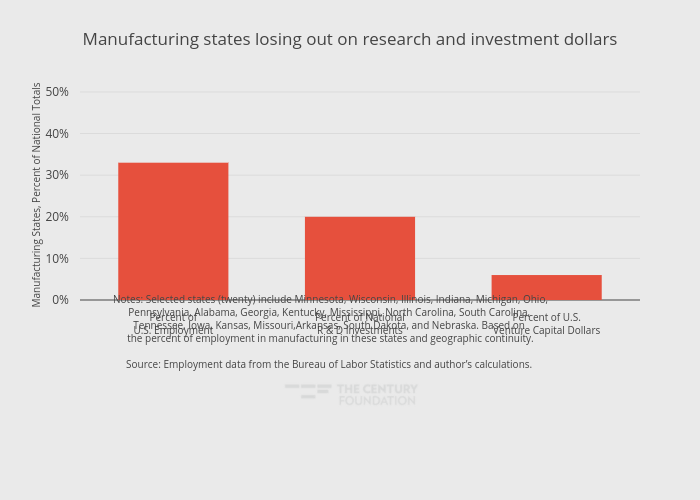
Thecenturyfoundation's interactive graph and data of "Manufacturing states losing out on research and investment dollars" is a bar chart, showing Percent of National Totals; with in the x-axis and Manufacturing States, Percent of National Totals in the y-axis.. The x-axis shows values from -0.5 to 2.5. The y-axis shows values from 0 to 50.473684210526315. This visualization has the following annotation: Notes: Selected states (twenty) include Minnesota, Wisconsin, Illinois, Indiana, Michigan, Ohio,<br>Pennsylvania, Alabama, Georgia, Kentucky, Mississippi, North Carolina, South Carolina, <br>Tennessee, Iowa, Kansas, Missouri,Arkansas, South Dakota, and Nebraska. Based on <br>the percent of employment in manufacturing in these states and geographic continuity.Source: Employment data from the Bureau of Labor Statistics and author’s calculations.